Hello, my name is Delaney Mayfield and I am going to tell you about all the different tips and ways to solve graphing problems. I have studied and researched to find the best sources about graphing. I used to have trouble with graphing but now I am fully confident in graphing problems. I will show you different ways to solve including some videos and pictures. I hope that you will understand graphing more clearly after visiting this site.
Here is a video that will help you understand the basics of graphing linear equations:
Just pay attention until 4:33
The first problem I will show how to graph will be problem set 22.4:
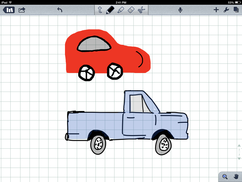
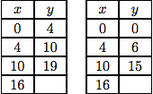
A car and a small truck started out from Exeter at 8:00 am. Their distance from Exeter, recorded at hourly intervals, are recorded in the tables at the right. Plot this information on the same set of axes and draw two lines connecting the points in each set of data. What is the slope of each line? What is the meaning of these slopes in the context of this problem?
A car and a small truck started out from Exeter at 8:00 am. Their distance from Exeter, recorded at hourly intervals, are recorded in the tables at the right. Plot this information on the same set of axes and draw two lines connecting the points in each set of data. What is the slope of each line? What is the meaning of these slopes in the context of this problem?
22.6
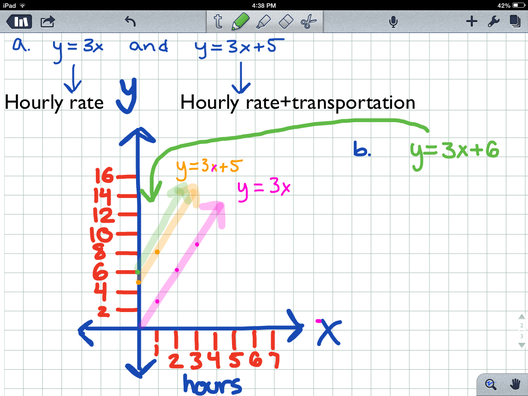
Day student Chris does a lot of babysitting. When parents drop off their children and Chris can supervise at home, the hourly rate is $3. If Chris has to travel to the child's home, there is a fixed charge of $5 for transportation in addition to the $3 hourly rate.
(a) Graph y=3x and y=3x+5. What do these lines have to do with the babysitting context? What feature do they have in common? How do they differ?
(b) Predict what the graph of y=3x+6 will look like. What change in the babysitting context does this line suggest?
In letter b, all you had to do was make a line one higher than y=3x+5.
23.5
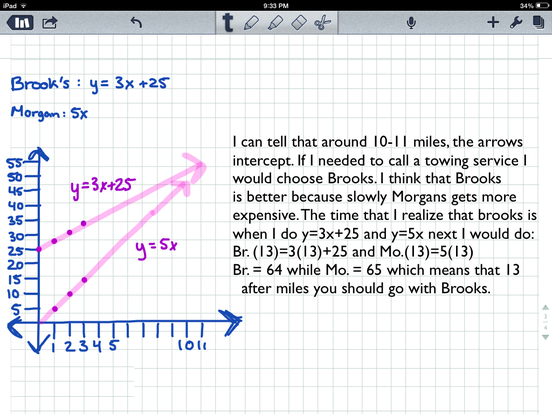
Drivers in distress near Exeter have two towing services to choose from: Brook's Body Shop charges $3 per mile for the towing, and a fixed $25 charge regardless of the length of the tow. Morgan Motors charges a flat $5 per mile. On the same system of axes, represent each of these choices by a lii88near graph that plots the cost of the tow versus the length of the tow. If you needed to be towed, which service would you call, and why?
Drivers in distress near Exeter have two towing services to choose from: Brook's Body Shop charges $3 per mile for the towing, and a fixed $25 charge regardless of the length of the tow. Morgan Motors charges a flat $5 per mile. On the same system of axes, represent each of these choices by a lii88near graph that plots the cost of the tow versus the length of the tow. If you needed to be towed, which service would you call, and why?
22.2
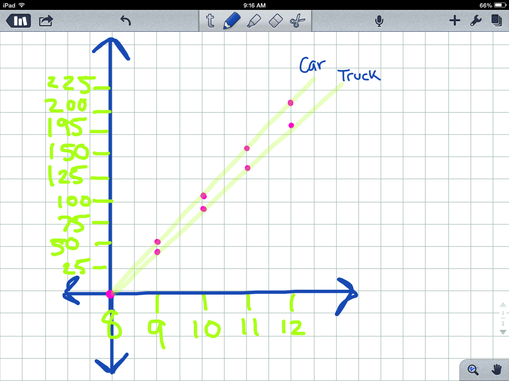
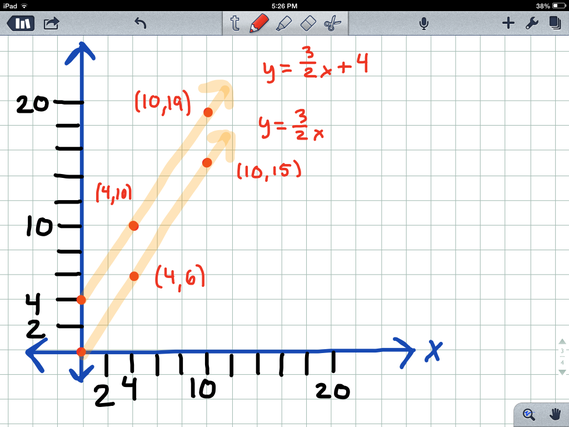
Plot the data from the tables in the previous question on the same set of axes and use a ruler to draw a line through each set of points. By looking at the graph, how could you recognize the direct variation? What similarities and differences are there between the two lines drawn?
Plot the data from the tables in the previous question on the same set of axes and use a ruler to draw a line through each set of points. By looking at the graph, how could you recognize the direct variation? What similarities and differences are there between the two lines drawn?
Notice that each dot represents an x and y. For example (4,6) all you had to do was go 4 on the x axis and up 6 on the y axis.
Future Problem, 28.5:
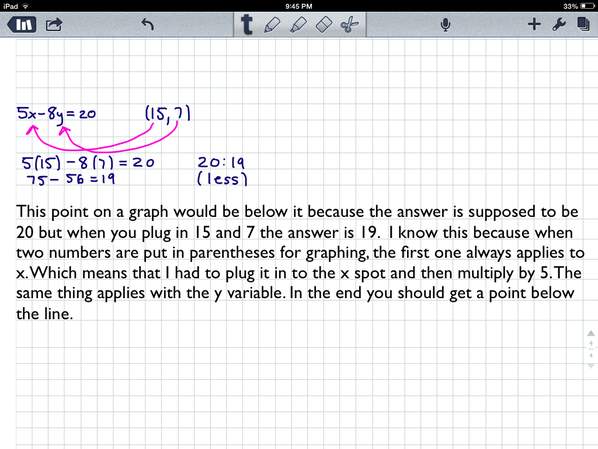
The equation 5x-8y=20 expresses a linear relationship between x and y. The point (15,7) is either on the graph of this, above it, or below it. Which? How do you know?
The equation 5x-8y=20 expresses a linear relationship between x and y. The point (15,7) is either on the graph of this, above it, or below it. Which? How do you know?
In conclusion, I think that after making this webpage I have a better understanding about graphing. Making a webpage made me realize how many steps their are to solving a graphing problem. I hope that my classmates and future students will be able to come back to my page and use it as a helpful guide. While I made this webpage I realized that Khan Academy is a great place to go if I have questions. I can't wait to see what my classmates webpages are like.
If you need further help please visit: http://phet.colorado.edu/en/simulation/graphing-lines or https://www.khanacademy.org/math/algebra/linear-equations-and-inequalitie
